Customer Effort Score (CES): A Key Metric for Assessing Customer Satisfaction and Loyalty
 Renat Zubayrov
The Customer Effort Score (CES) metric is a way to measure the level of effort that a customer has to put in to resolve their issue or fulfill their request. Let's dive in and explore the power of the Customer Effort Score as a part of the Customer Health Scoring model that provides value for a business and can help improve customer experience, reduce customer effort, increase customer loyalty, and ultimately drive revenue growth.
It is usually a single-question survey that is sent to customers after they have interacted with a company's customer service team, product or service. The question typically asks customers to rate the level of effort they had to put in on a scale of 1 to 5, with 1 being "very low effort" and 5 being "very high effort". Some companies also use a 7-point scale.
For example, the question on the survey may be worded as "On a scale of 1-5, how much effort did you personally have to put forth to handle your request?" or "On a scale of 1-5, how easy was it for you to get your problem solved?"
The CES score can then be used as a key metric for assessing customer satisfaction and loyalty. A lower score generally indicates that the customer had a positive experience and that the company's customer service team or product/service is easy to use, while a higher score indicates that the customer had a more difficult time and that the company may need to improve in certain areas.
For example, a company might see that their CES scores are consistently low for customers who contact them via phone, but high for those who use their online chat service. This would indicate that the company needs to improve the phone experience for its customers.
Another example, a company might find out that a certain product has a high CES score, which means that the product is hard to use or the instructions are not clear, thus the company could improve the product by redesigning it or providing better instructions.
Overall, the CES can be a valuable metric for identifying areas where improvements can be made in order to increase customer satisfaction and loyalty, and it can be used to track progress over time.

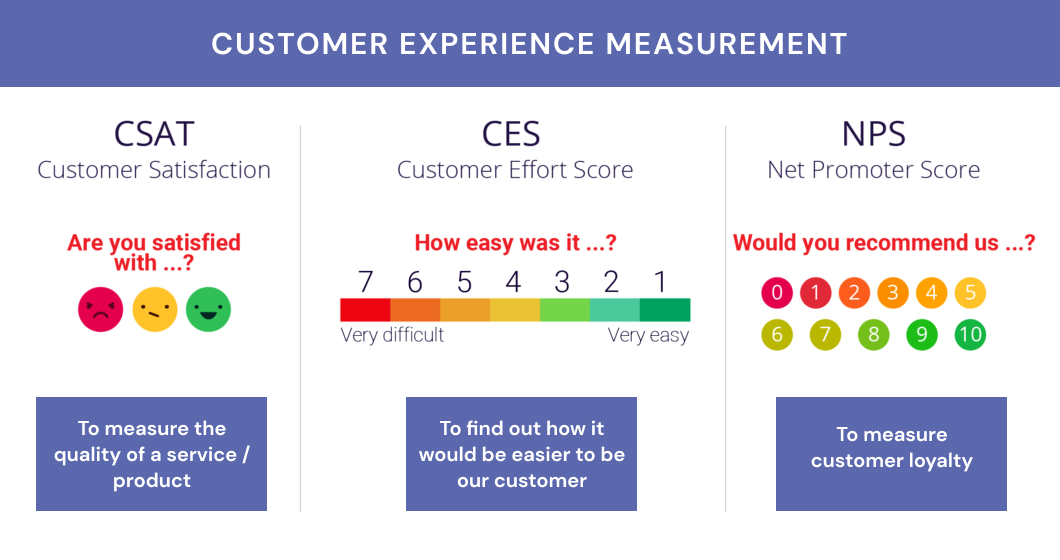
Pic.1 Customer Experience Measurement: Customer Satisfaction - Customer Effort Score - Net Promoter Score
Also to measure how well your company is doing in this regard, you can track various metrics, including Customer Satisfaction Score, and Net Promoter Score. In our blog, we'll explore what these metrics are, how they differ, and why they matter to your business.
Benchmarks
A good value for the Customer Effort Score (CES) metric would be a low score, typically in the range of 1-2 on a 5-point scale, or 1-3 on a 7-point scale. These scores indicate that the customer had a positive experience and that the company's customer service team or product/service is easy to use.
While benchmark data on CES can vary based on a number of factors, here are some general benchmarks across different industries:
- Retail: According to a survey by Gartner, the average CES score for retail companies is 4.3 out of 5.
- Banking: In the banking industry, the average CES score is around 4.4 out of 5, according to a survey by the Corporate Executive Board.
- Telecommunications: A study by the Temkin Group found that the average CES score for telecom companies is around 3.6 out of 5.
- Healthcare: According to a survey by the Advisory Board Company, the average CES score for healthcare providers is around 4.2 out of 5.
- Insurance: A study by the Temkin Group found that the average CES score for insurance companies is around 3.9 out of 5.
It's also important to keep in mind that it's not just about achieving low scores but also about tracking the trend of the scores over time. As a general rule of thumb, companies should aim to see an improvement in CES scores over time, as this would indicate that they are making progress in increasing customer satisfaction and loyalty.
It's also important to consider other factors that may affect the CES score, such as the type of customer, the type of issue or request, and the channel of communication. For example, a customer who is calling in with a more complex issue may have a higher CES score than a customer who is calling in with a simple question. It's important to track and analyze the CES scores by these different factors to identify specific areas where improvements can be made.
Challenges
Measuring and controlling for Customer Effort Score (CES) can present a number of challenges. Some of the typical challenges include:
- Sampling bias: It is important to have a representative sample of customers to ensure that the CES scores are accurate. If the sample is not representative, the scores may not accurately reflect the experiences of the overall customer population.
- Response bias: It's also important to consider the response bias, customers might have a different level of willingness to participate in surveys, and that may affect the results.
- Difficulty in determining the cause of high scores: High CES scores may be caused by a variety of factors, such as poorly designed products or services, inadequate training of customer service representatives, or poor processes and procedures. Identifying the root cause of high scores can be difficult, and it may require further investigation and analysis.
- Difficulty in making improvements: Even after the root cause of high CES scores have been identified, making improvements can be difficult. It may require significant changes to products, services, processes, or procedures, and it may take time to see the results of these changes.
- Difficulty in tracking progress over time: It's important to track the CES score over time to see if the company is making progress in improving customer satisfaction, but it can be difficult to do so, as it depends on a number of factors such as changes in customer demographics, new products, or changes in the industry.
Alternatives
There are several alternative metrics that can be used to measure customer satisfaction and loyalty, in addition to the Customer Effort Score (CES). Some of the most commonly used metrics include:
- Net Promoter Score (NPS): This metric measures customer loyalty by asking customers to rate the likelihood of recommending a company's products or services to others. It is a simple one-question survey that asks customers to rate on a scale of 0-10, how likely they are to recommend the company to a friend or colleague.
- Customer Satisfaction Score (CSAT): This metric measures customer satisfaction by asking customers to rate their overall satisfaction with a company's products or services on a scale of 1-5 or 1-7.
- First Contact Resolution (FCR): This metric measures the percentage of customer issues or requests that are resolved during the initial contact with a company's customer service team.
- (Median) Time to Full Resolution (TTR): This metric measures the amount of time it takes for a company to resolve a customer's issue or request.
- Repeat Purchase Rate (RPR): This metric measures the percentage of customers who make additional purchases after their first purchase.

Are you looking to improve your customer success strategy and boost your business growth? Look no further than our practical course on Customer Health Scoring, including a customizable template! And now with a code LINKEDIN50 you’ll get a 50% off the regular price.
This practical course provides valuable insights into using customer health scoring to improve customer engagement, retention, and loyalty. You will learn how to develop a robust customer health score metric and track it over time to identify trends and opportunities for improvement.
Enroll in our course now and receive step-by-step instructions on how to create a personalized template for measuring the health of your customer relationships. With the guidance of our experienced instructors, you'll be able to easily and efficiently start tracking your customer success.
Don't hesitate to enroll and begin enhancing your customer success today!
Read more about revenue operations, growth strategies, and metrics in our blog and follow us on LinkedIn, Youtube, and Facebook.
← Go back to blog